· Tableau · 2 min read
Using the Show Me Pane in Tableau
Intro
The Show Me pane in Tableau is a fantastic feature that makes it super easy for you to create awesome visualizations in no time.
In this blog post, we'll take a closer look at the worksheet view in Tableau, the building blocks of everything else Tableau can do
The Show Me Pane
To use the show me pane, you have to do is select the data you want to use, and then choose the type of visualization you want to create from the Show Me pane. There are so many different options to choose from, like bar charts, line graphs, scatter plots, maps, and more. It’s a great way to get started with Tableau and start exploring all the different ways you can visualize your data. Plus, once you’ve created your visualization, you can customize it to your heart’s content by adding labels, changing the formatting, and more. So go ahead and give it a try – you’ll be amazed at how easy it is to create beautiful, insightful visualizations.
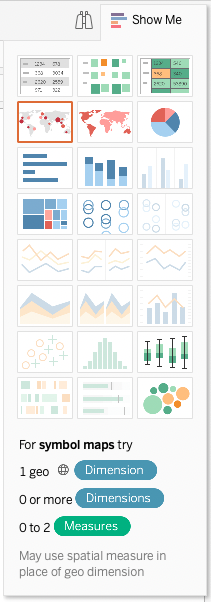
When using the show me pane, charts that you currently have fields of the right types of data for in your active worksheet will be available. Unavailable visualiusation types will be greyed out. Click on any visualisation to see the prerequisites at the bottom of the panel!
Watch out though! Selecting a visualisation will cause Tableau to reconfigure your worksheet to the default of the selected visualisation. This may occasionally cause unwanted results such as fields moving from the columns shelf to the rows shelf, or fields moving from a marks shelf pill to columns or rows. The best way of working is to choose your visualisation from the show me panel as early in the development of your worksheet as possible and edit it from there!
Learn how to navigate Tableau dashboards and create comprehensive overviews of your data.