· Tableau · 3 min read
Understanding the Tableau Objects Panel
Intro
In this post, we’ll take a closer look at the Objects Panel in Tableau, a pane that displays a list of objects.
This post is part of a series. You can read the previous post here.
In this post, we will cover the four types of content that make up a Tableau workbook: data, worksheets, dashboards, and stories
Navigating the Objects Panel
In Tableau, the Objects Panel is a pane that displays a list of objects.
Worksheet View
When you are working in the worksheets view, this panel will contain all your data and is also known as a data pane.
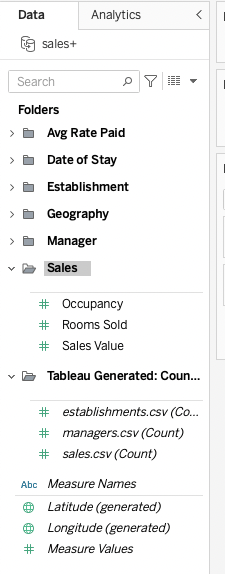
There are certain elements of the Objects Panel that will be created by Tableau rather than existing in your underlying dataset. These may include:
- Measure Names and Measure Values fields: These can be used to display multiple measures in a single visualisation.
- Generated Latitude and Longitude: These are fields that Tableau creates based on geographical information available in the data set. These can be useful when you have address information but not latitude and longitude.
- Default count measures: The default count measures are measures that are automatically created when you connect to a data source. These measures are used to count the number of records in your data source. When you have multiple data sources joined together you may have a count for each element.
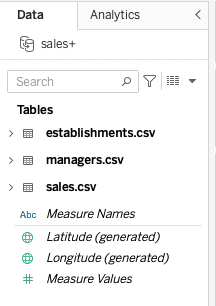
Measures within your data pane may be displayed in one of two ways.
By default Tableau will display your variables by data set. This means that if you have lots of data sets joined together your variables will be displayed by the data set they are part of.
This is great when you’re handling data with an intuitive underlying structure and not too many columns, but can become unweildy when you are dealing with hundreds of variables, particularly when some of them are calculated. This is where the Group by Folder option comes in. This functionality enables you to manually create folders to group your data however you wish. If you look at the example Tableau files - this is grouped by folder!
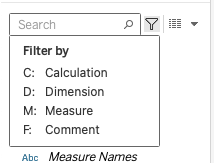
Another challenge when you have lots of fields can be finding the specific field you are looking for. Save yourself hours of scrolling and searching with the search box! This handy option allows you to search for a variable by field name and can save you hours of hunting.
Pro Tip: You can constrain your results by data type - e.g. ask Tableau to show you only calculations (fields not in the underlying data source, that you have created in Tableau), dimensions or measures
The Objects Panel in Dashboards
When you are working in a dashboard the objects pane will consist of two tabs:
-
The dashboard tab contains a list of all the worksheets in your file, an option to change the size of your dashboard (this is super important for making sure your fantastic reports work on all devices!) and a set of more generic objects that you can add to your dashbaords such as images, text boxes, tiles and much more.
-
The layout tab will contain all the options required to format your individual dashboard elements as you start to build. You will spend a lot of time in this tab as you build your dashboards!
The Objects Panel in Stories
When you’re working in stories you may want to drag elements of dashboards or sheets into your story. You will find all the dashboards and sheets in your file on the ‘Story’ tab of this objects pane. You can also add and duplicate story points from here and add text.
The layout tab in stories is where all your formating options are working in stories, to get your presentation exactly how you want it
In this blog post, we'll take a closer look at the worksheet view in Tableau, the building blocks of everything else Tableau can do